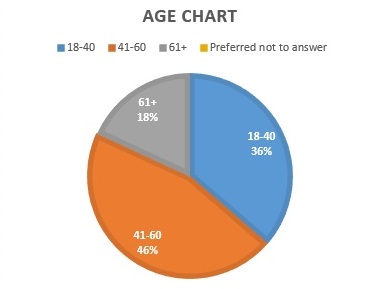
| Age 18-40=36% 41-60=46% 61+=18% Preferred not to answer=0% |
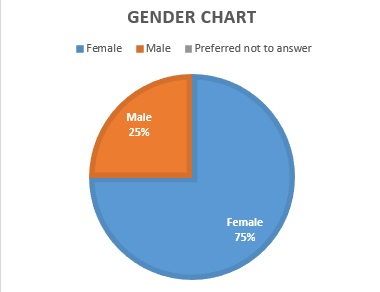
Gender Female=75% Male=25% Preferred not to answer=0% |
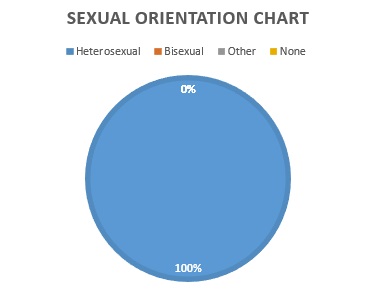
Sexual Orientation Heterosexual=100% Bisexual=0% Other=0% Preferred not to answer=0% |
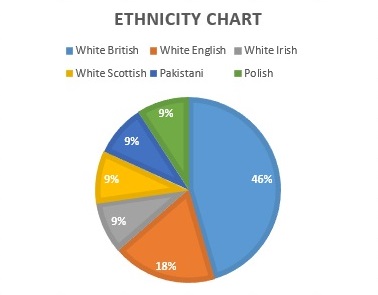
| Ethnicity White British=46% White English=18% White Irish=9% White Scottish=9% Pakistani=9% Polish=9% |
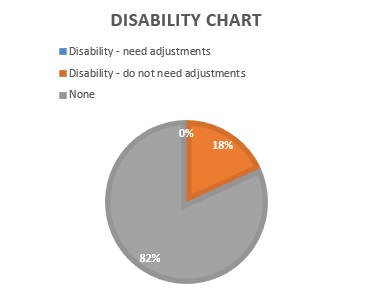
Disability No disability=82% Disability, need adjustments =0% Disability, do not need adjustments=18% |
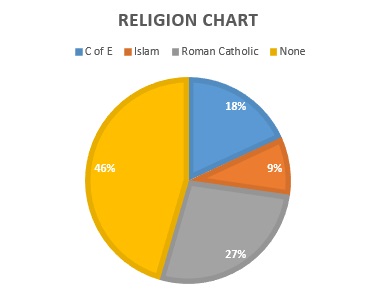
Religion Church of England=18% Islam=9% Roman Catholic=27% None=46% |
 |
 |
 |
 |
 |
 |